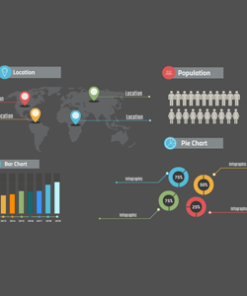
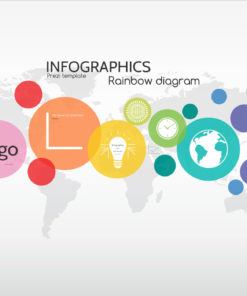
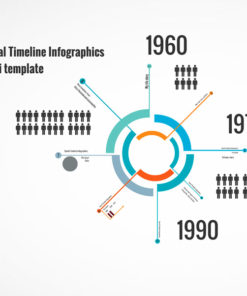
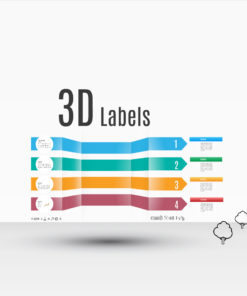
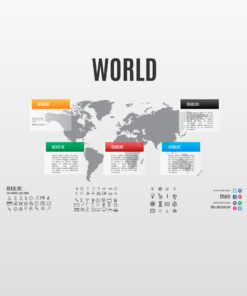
3D world map background, semitransparent colorful circles. With infographics, you can tell the history, enumerate major features, describe events in a timeline, showing statistics, and display various types of data.
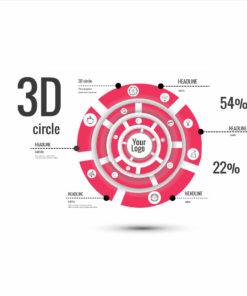
Best for statistics related topic and has red coloured technology circles. The design of presentation includes shadows and red circles. Trick is that you can change the background of circle very easily. The presentation is recommended for topics: statistics, futurism, business, management, sales.
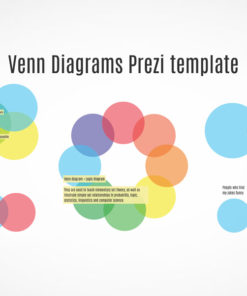
Venn diagrams infographics has a cool effect when zooming in and moving from one slide to another. Change the slides, move them. Most of the graphical elements, images are separate and can be moved, resized. Move, scale and rearrange and don’t lose any quality while zooming in, because all elements are vector based. Zoom in and add your own content anywhere in the Prezi. Duplicate and add more elements.
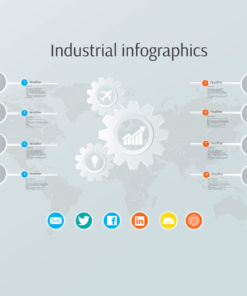
Industrial infographics has world map background and machinery symbols like gears and colorful buttons with social symbols. Prezi has a simple design and colorful 3D like buttons, where you can put your content of a slide. Best use for this template is for presenting business data or business statistics which are related to the industry.
