Animated Multi-purpose template with small blue semi-transparent boxes for Technology related topics.
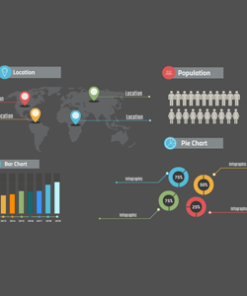
Infographics layout on a dark background. For showing location, information, statistics, bar chart, pie chart. Includes timeline infographic, vector based gray world map. Dark World map with pointer marks. Dark infographics layout for any statistics related topics.
3D world map background, semitransparent colorful circles. With infographics, you can tell the history, enumerate major features, describe events in a timeline, showing statistics, and display various types of data.
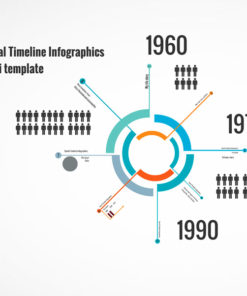
With spiral timeline design layout and sample infographics. Tell your story using timeline and displaying a list of events in chronological order. Includes vector design elements, dates, reports. Example presentation topics: business, education, info chart, computer, statistics, report, graph.
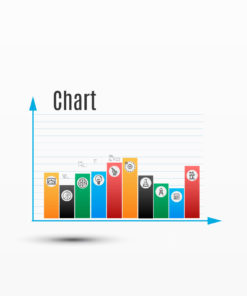
Simple bar graph has simple 2D colorful bars, x and y-axis over the lined background. The presentation is recommended for topics like statistics, mathematics, calculus, counting, calculus, marketing, business. Place your text and data over the blue lined background.
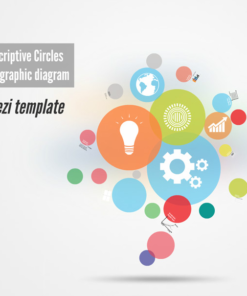
Descriptive Circles template has a cool effect when zooming in and moving from one slide to another. Change the slides, move them. Most of the graphical elements, images are separate and can be moved, resized.
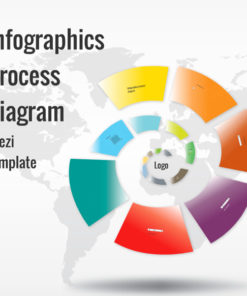
Infographics process diagram has a cool effect when zooming in and moving from one slide to another.
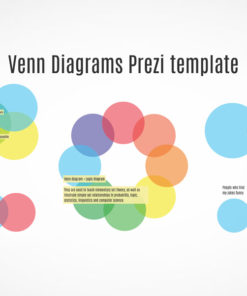
Venn diagrams infographics has a cool effect when zooming in and moving from one slide to another. Change the slides, move them. Most of the graphical elements, images are separate and can be moved, resized. Move, scale and rearrange and don’t lose any quality while zooming in, because all elements are vector based. Zoom in and add your own content anywhere in the Prezi. Duplicate and add more elements.
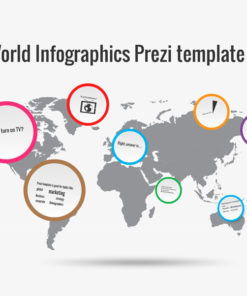
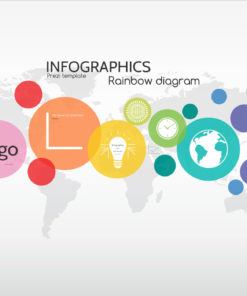
World Infographics is suitable for many topics – Education, business, infographics, data illustration.